
August 3, 2018
MANILA—Coming from their Regional Development Plans (RDPs), regions must enhance growth drivers and tap new ones to reach or even exceed medium-term development targets, the National Economic and Development Authority (NEDA) said.
Latest release of gross regional domestic product (GRDP) data show that three regions had exceeded their GRDP target for 2022 as early as 2017 while four have met their targets early as well. Nine other regions continue to work towards reaching their 2022 targets.
“Our latest figures are very promising. And we are confident that all regions will be able to meet, and even exceed, their targets come 2022 with their current development framework. The national government is behind the regions in sustaining their growth momentum,” Socioeconomic Planning Secretary Ernesto M. Pernia said
Cordillera Administrative Region (CAR) and Central Luzon showed strong economic performance in 2017, exceeding their 2022 targets which were set at 5.3 to 6. 3 percent and 6.3 to 7.3 percent, respectively. From a baseline of -0.4 percent in 2015, the Autonomous Region in Muslim Mindanao (ARMM) had also already exceeded its 2022 target of 5.25 to 5.68 percent.
In 2017, CAR posted 12.1 percent year-on-year economic growth; Central Luzon hit 9.3 percent; and ARMM reached 7.3 percent.
Four others such as Cagayan Valley, Calabarzon (Cavite, Laguna, Batangas, Rizal, Quezon), Mimaropa (Mindoro, Marinduque, Romblon, and Palawan) and Davao have reached their 2022 GRDP targets in 2017.
Regional growths are guided by regions’ RDPs and investment programs crafted by respective NEDA regional offices in collaboration with their regional development councils.
Each RDP has set the region’s end-of-plan targets for economic indicators such as GRDP growth and poverty incidence using the 2015 and 2016 figures as their baseline data (See Annex A).
“To sustain growth momentum and build strong regional economies, we must increase competitiveness, innovativeness, and resilience of industries and services,” Pernia said.
For example, Central Visayas region must take advantage of the potentials of the seaweed, dried mangoes, furniture, the Business Process Management, shipbuilding, and tourism industries as highlighted in its regional development plan.
“We advocate strengthening support to the region’s growth drivers, as well as generating new growth drivers. This is alongside the push for infrastructure development to improve connectivity, productivity, and technology adoption,” Pernia said.
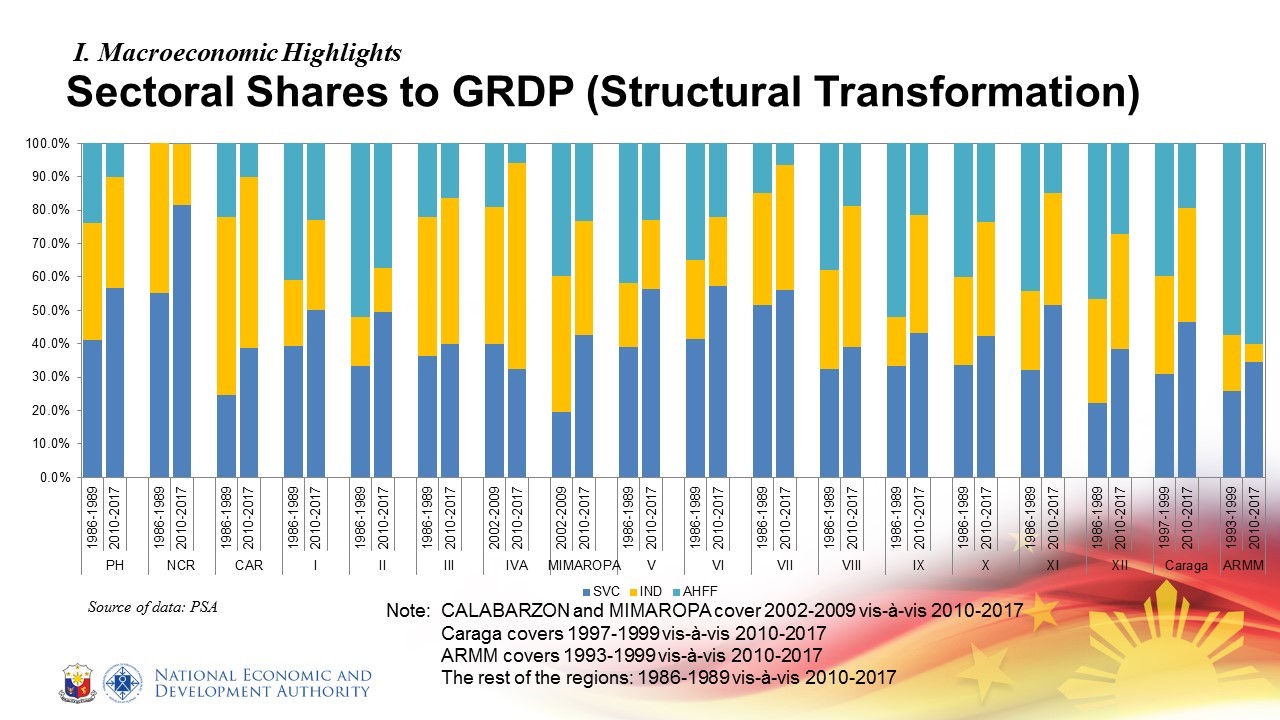
Pernia likewise noted the economic structural transformation experienced by the regions.
Upon comparing data between two given periods from 1986 to 2017, NEDA found that in all regions, except the ARMM, the shares of industry and services increased (See Annex B).
The agriculture sector’s share in ARMM has increased. CAR, MIMAROPA, Cagayan Valley, Bicol, Western Visayas, and Socsargen are more service-based at present compared to the 1980s.
Calabarzon and Eastern Visayas regions, on the other hand, are more industry-based.
“Similar to the structural transformation experienced by the country as a whole, the sources of economic growth in regions continue to broaden and diversify,” Pernia said.
Annex A: Regional Development Outlook
| Baseline GRDP Growth | Actual Year-on-year GRDP Growth (2017) | RDP GRDP Growth Target (2022) | |
| National Capital Region | – | 6.1 | – |
| Cordillera Administrative Region | 4.0
(2015) |
12.1
(2017) |
5.3-6.3 |
| Ilocos Region (Region 1) | 5.4
(2015) |
5.8
(2017) |
7.2-8.0 |
| Cagayan Valley (Region II) | 3.8
(2016) |
7.2
(2017) |
6.5-7.5 |
| Central Luzon (Region III)
|
5.6
(2015) |
9.3
(2017) |
6.3-7.3 |
| CALABARZON (Region IV-A) | 5.8
(2015) |
6.7
(2017) |
6.0-7.3 |
| MIMAROPA | 2.0
(2015) |
6.2
(2017) |
6.2-7.2
|
| Bicol Region (Region V) | 8.9
(2015) |
5.1
(2017) |
11.2 |
| Western Visayas (Region VI) | 8.8
(2015) |
8.4
(2017) |
9.8-11.0 |
| Central Visayas (Region VII) | 4.9
(2015) |
5.1
(2017) |
8.3-8.8 |
| Eastern Visayas (Region VIII) | 4.6
(2015) |
1.8
(2017) |
6.8-7.0 |
| Zamboanga Peninsula (Region IX) | 7.7
(2015) |
2.3
(2017) |
7.2-8.3 |
| Northern Mindanao (Region X) | 5.7
(2015) |
5.9
(2017) |
6.1-8.2 |
| Davao Region (Region XI) | 8.2
(2015) |
10.9
(2017) |
10.5-11.5 |
| SOCCSKSARGEN (Region XII) | 3.3
(2015) |
8.2
(2017) |
8.9-9.4 |
| CARAGA (Region XIII) | 4.5
(2015) |
4.3
(2017) |
7.1-7.8 |
| Autonomous Region in Muslim Mindanao (ARMM) | -0.4
(2015) |
7.3
(2017) |
5.25-5.68 |
Source: PSA and RDP 2017-2022 Results Matrices
Annex B
-End-